As part of our broader sustainability strategy, Range focuses on absolute carbon emissions and emissions intensity reductions which allows us to fully evaluate opportunities for emissions reductions, mitigate risks, and take advantage of opportunities, all of which ultimately supports our long-term value proposition. We believe that this approach, along with our proactive review and implementation of innovative technologies, design changes, and new processes, leads to more effective and efficient direct GHG emissions reductions. Additionally, ongoing reviews of GHG emissions are conducted by source and type, which has led to additional opportunities for reductions through our interdisciplinary approach.
Figure 7.4
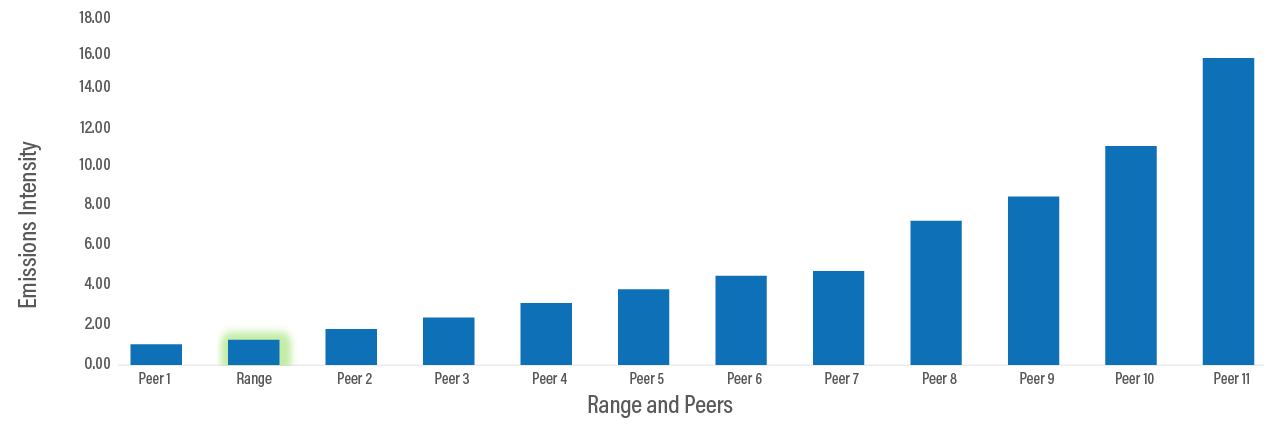
Source: Enverus as of June 12, 2023
These reviews, analyses, and actions are paying off in the form of emissions reductions. Based on third-party data from Enverus, we are estimated to rank second lowest in CO2e emissions intensity in a group of our 11 proxy peers due to our investments in reducing emissions intensity, our operational efficiencies, and Appalachia’s advantaged emissions profile relative to other operating regions (Figure 7.4).
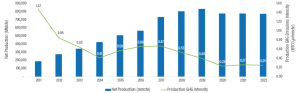
In Figure 7.5, we show Range’s historical record of reducing our production emissions intensity. To normalize the data, the graph is based only on emissions related to production and excludes gathering and boosting-related emissions, as we began tracking and reporting on those types of emissions in 2016. Indicative of our longstanding commitment and successful initiatives to reduce emissions intensity, Range has seen an overall rate of GHG productions emissions intensity decrease by 83 percent from 2011 to 2022. While we have achieved significant progress, we remain dedicated to finding economic solutions to continue to work toward further reductions of our GHG emissions intensity.
Figure 7.5
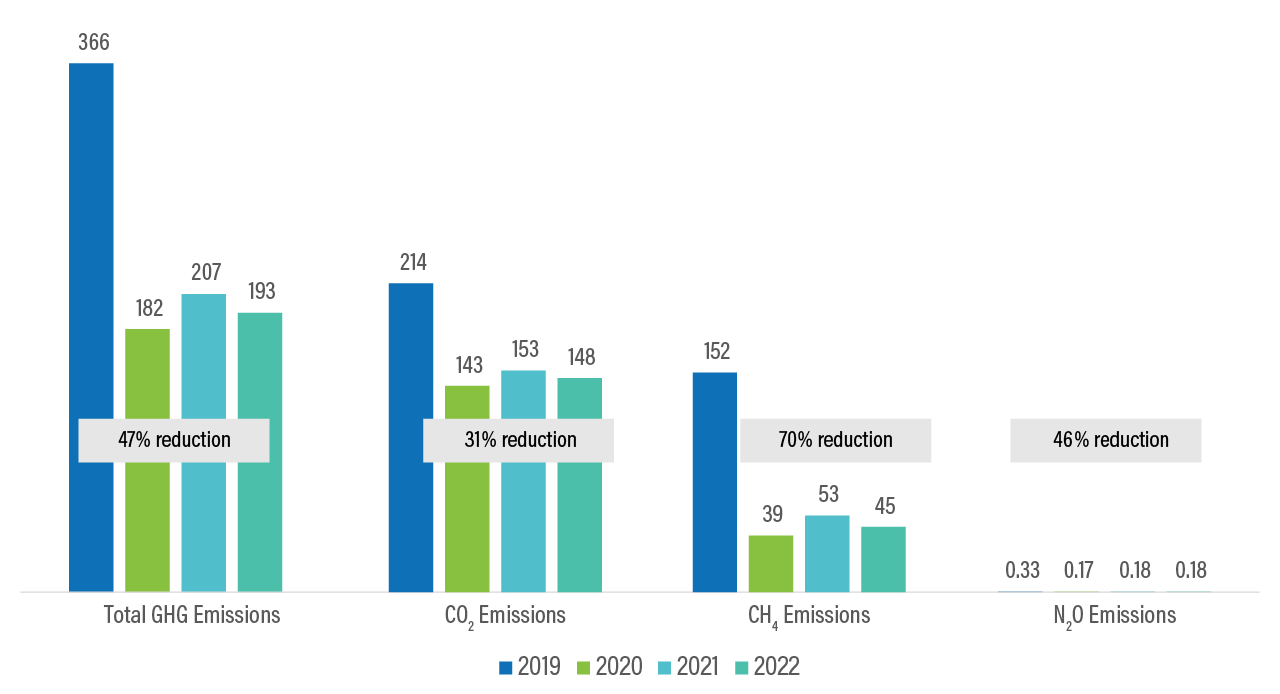
Specifically, between 2019 and 2022, we achieved a 47 percent decrease in our absolute Scope 1 GHG emissions, including the emissions from boosting and gathering segment1. During this period, we achieved similar levels of reduction across all types of GHGs with a 31 percent reduction in direct carbon dioxide emissions and a 70 percent reduction in methane emissions. Additionally, from 2019 to 2022, we decreased our nitrous oxide emissions by 46 percent (Figure 7.6). Our journey to emissions reduction and seeking to achieve net zero Scope 1 and 2 GHG emissions by 2025 is not and will not be linear, but our trend line over the past four years is reflective of our overall commitment to reducing emissions and reaching our goals.
Figure 7.62
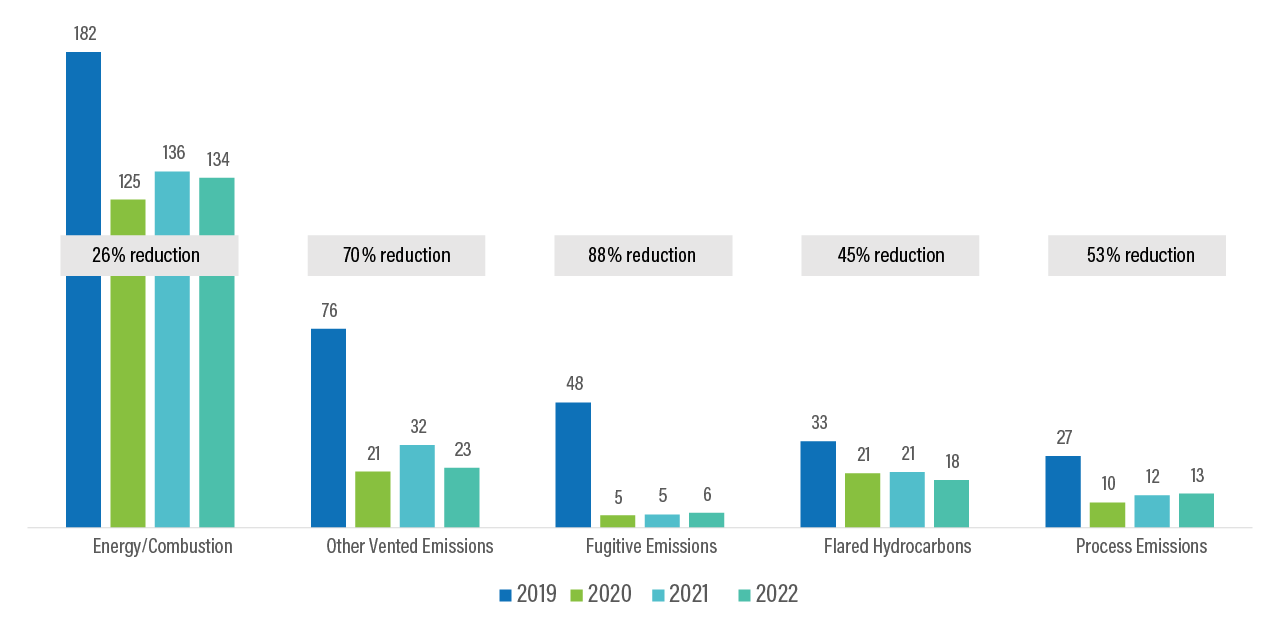
Between 2019 and 2022, emissions related to combustion decreased by 26 percent, in part due to our use of natural gas instead of diesel for several of our combustion sources and the sale of our North Louisiana assets. Other vented emissions dropped by 70 percent, primarily as a result of our installation of plunger lift systems, our zero emissions flowback initiative, and the sale of our North Louisiana assets. Fugitive emissions have seen a significant decrease over the past four years, with 2022 fugitive emissions representing an 88 percent decrease relative to 2019 due to design improvements identified during optical gas imaging (OGI) inspections. Flared hydrocarbons and process emissions have also decreased by 45 and 53 percent respectively since 2019 and have remained a minimal percentage of our overall emissions (Figure 7.7).
Figure 7.73
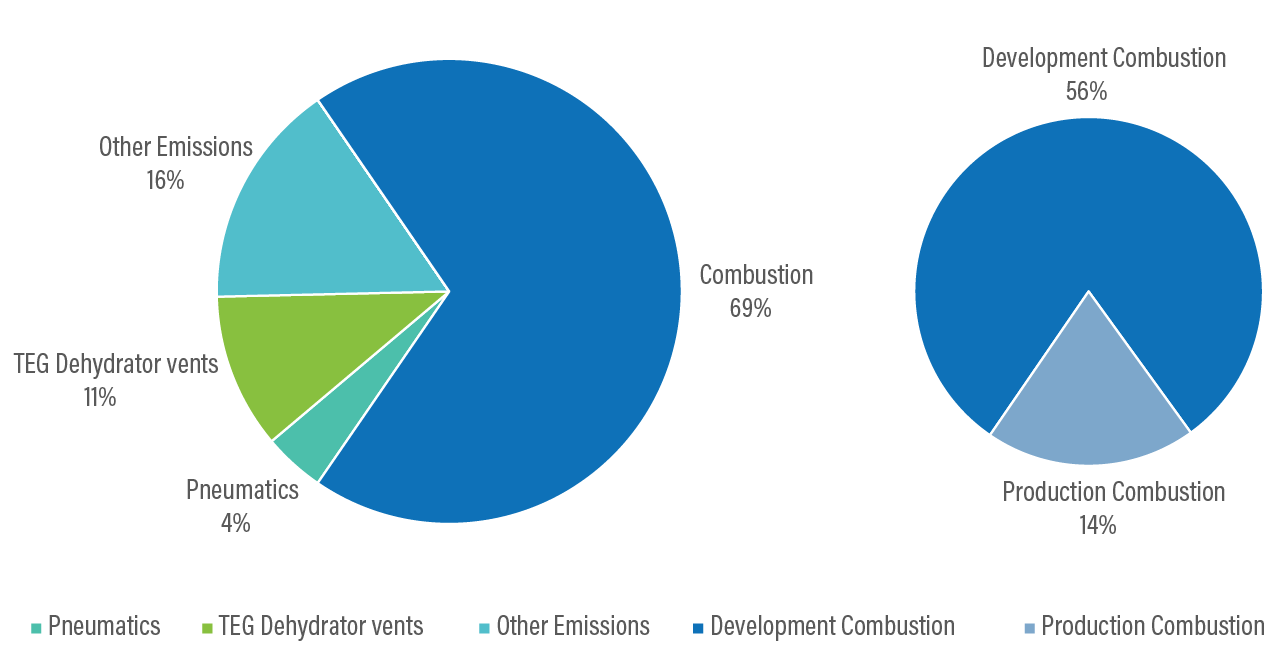
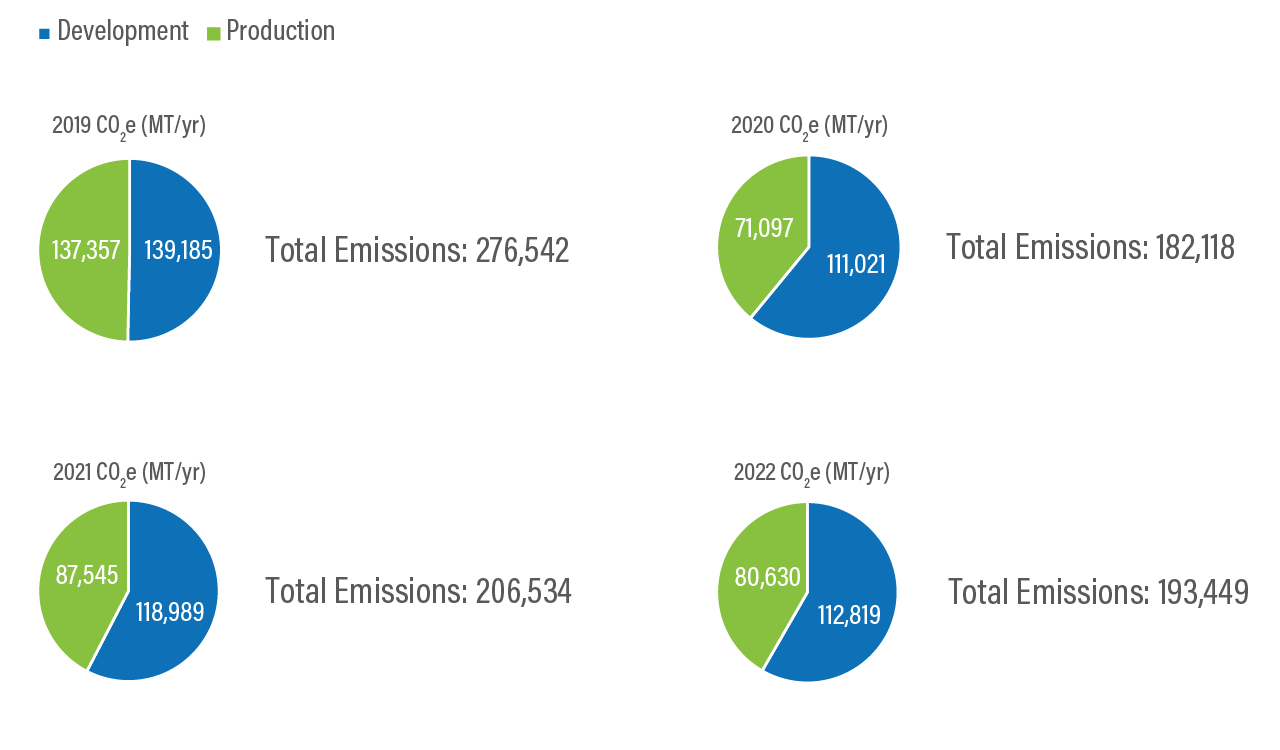
To better communicate what drives our emissions and identify opportunities for further reductions, we have evaluated our emissions profile and categorized the emissions by development (emissions that are the result of using fuel to create power or heat for the drilling and completing of a well) and production (process and gathering emissions). We believe this added level of transparency is helpful to our stakeholders in understanding our operations.
Figure 7.8
While the development phase of the well is a relatively short timeframe compared to the multi-decade production phase of a well, the development phase can also be a significant contributor towards overall GHG emissions depending upon development activity levels.
Figure 7.9
Development emissions exist in every business that uses or produces energy, whether its development of a coal mine, construction of a wind farm, or manufacturing of solar panels, but in the natural gas industry, these emissions mostly stem from the fuel needed to create power for the drilling or completing of a well. We are actively evaluating and exploring new technologies and fuel strategies to help us reduce our development emissions. Ultimately, we are striving to invest in development technology that increases efficiency while reducing our carbon footprint.
Since 2019, Range’s production emissions in Pennsylvania have decreased more than 41 percent, largely driven by our robust LDAR program and engineering solutions such as electric glycol pump installation on dehydrators and plunger lift installation. As part of our continued effort to minimize emissions, we have undertaken additional effort to quantify emissions and critically evaluate our inventory. As part of that effort, in 2022 we established a more robust process for documenting our equipment inventory particularly for pneumatic devices which resulted in a reduction to the inventory for these devices.
Figure 7.10
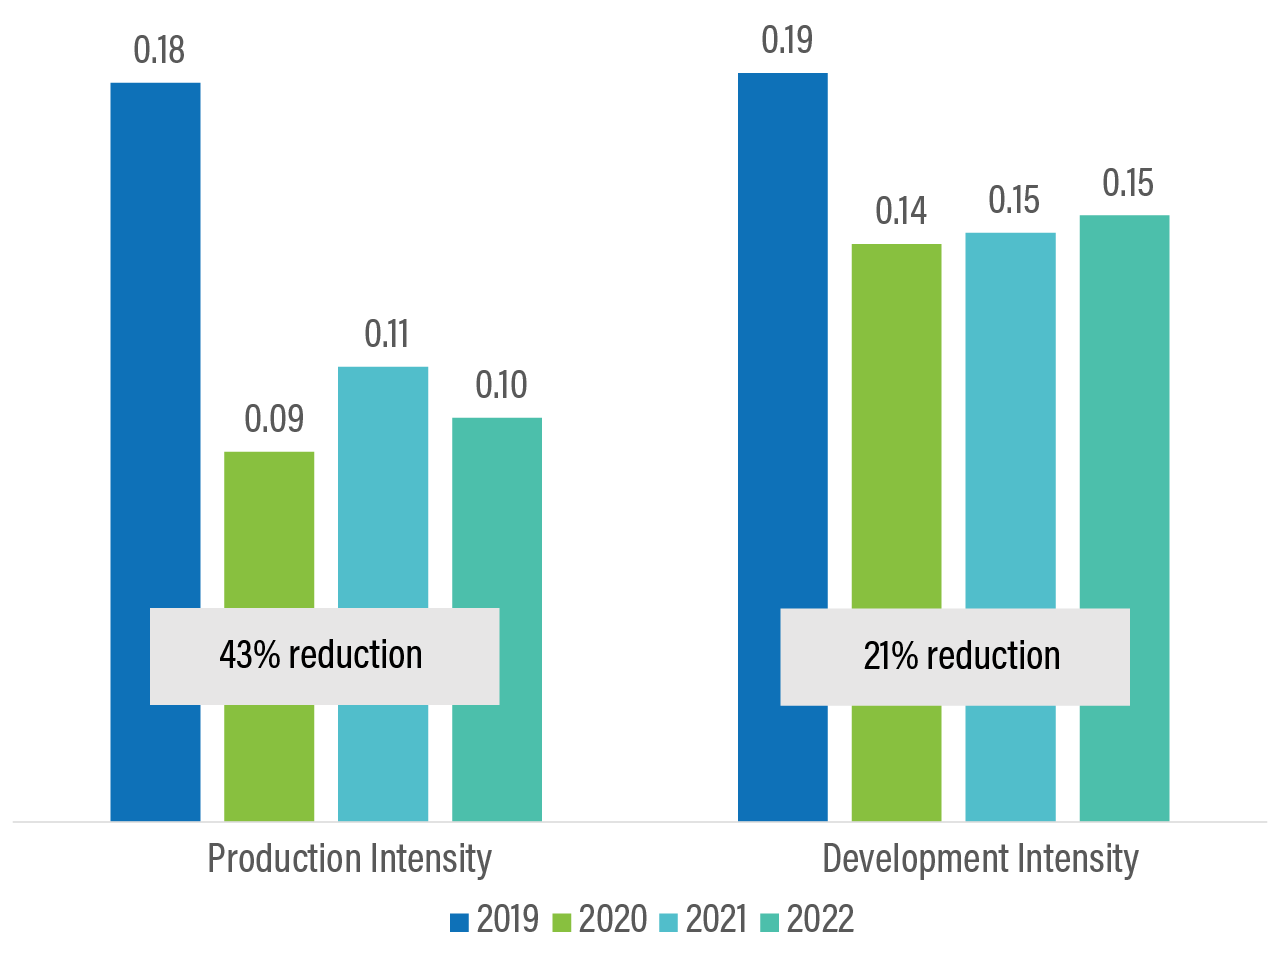
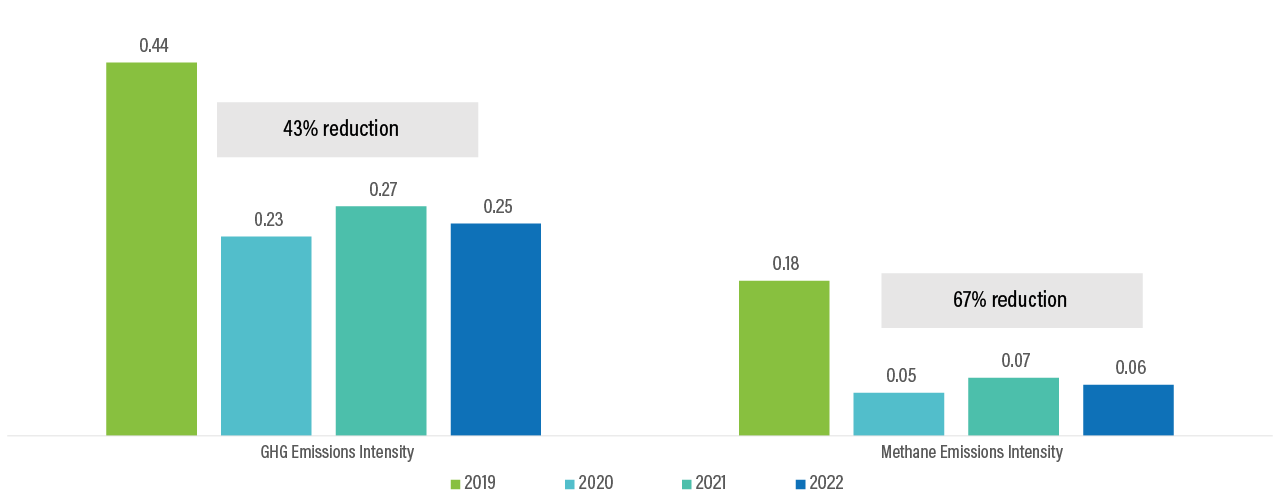
As previously mentioned, our overall emissions intensity (including emissions from gathering and boosting) improved as our production in Pennsylvania increased while overall emissions decreased over the past four years. This resulted in a 43 percent reduction in GHG emissions intensity from 2019 to 2022, while our methane emissions intensity was reduced by 67 percent during the same period (Figure 7.11). The slight uptick in emissions intensity from 2020 to 2021 reflects our ongoing development program that turns more wells to production each year. In 2022, we added wells to production, but the related production emissions increases were more than offset by our ongoing emissions management efforts.
Range regularly assesses opportunities to decrease our emissions using multiple approaches – an assessment that is not limited to design and process changes that reduce our emissions significantly. This includes our investment in the use of Compressed Natural Gas (CNG) in our Pennsylvania-based vehicles over the past four years, which ultimately helps limit our vehicle emissions.In 2022, 52 percent of the total gallons used by CNG capable vehicles in our fleet were CNG. Increasing the use of CNG within our vehicles is just one example of Range’s focus on identifying increased efficiencies to reduce emissions.
Figure 7.116
Recent initiatives at Range have been focused on new technologies and other emissions reduction initiatives, primarily addressing emissions associated with flaring, venting, stationary engines, liquid unloading, tanks, heaters, reboilers, and completion engines. Our top emissions reduction initiatives over the past few years have included:
We are committed to advancing several implementation changes and new technology adoptions, which will further improve our performance. Some highlights of 2023 initiatives to improve our absolute GHG emissions and emissions intensity include:
Range earned an “A” grade for its natural gas production from its Southwest Pennsylvania (SWPA) assets in connection with the MiQ Standard v.1.0 following an independent audit. Range’s robust source-level facility level detection and mitigation program was recognized as an effective alternative to top-down surveys. This achievement validates Range’s commitment to managing, reducing, and accurately reporting methane emissions from our operations and marks the next step in third-party certification beyond a pilot project. The audit process included a thorough review of Range’s calculated methane intensities, emissions management operating practices and procedures, and the deployment of detection and mitigation.
Given Range’s longstanding commitment to emissions management, reduction, and mitigation, which includes practices exceeding regulatory requirements (such as 8x per year LDAR surveys), we were pleased with the results of the audit. The audit and certification further recognized Range’s approach to emissions risk mitigation, highlighting the Company’s facility focused efforts on engineering and design along with a class-leading leak detection and repair program. We believe our strong focus on source-level emissions control sets us apart from peers. Completion of the audit allows Range the opportunity to market gas production volumes from its SWPA assets, over 2 BCF/day, as independently certified gas via MiQ’s Digital Registry for the period of June 1, 2023, to May 31, 2024. Range is proud of this achievement and remains focused on continual improvement of its emissions management program.
Carbon offsets are currently an integral part of achieving our goal of net zero GHG emissions by 2025 on a Scope 1 and Scope 2 basis. We have made significant progress this year in purchasing and contracting for credits across a diverse set of high-quality projects. All the credits in our portfolio are derived from projects conforming to methodologies established by either Verra or the American Carbon Registry. These leading registries apply rigorous rules and require independent monitoring and validation of impact in order for credits to be issued. A key component of our net zero strategy was to partner with C-Quest Capital, an award-winning global carbon project developer, to replace existing cooking stoves in sub-Saharan Africa with new, cleaner and more efficient cookstoves. The deployment of these cookstoves provide a variety of social and humanitarian benefits in addition to reducing carbon emissions. These cookstoves deliver better health conditions and improved quality of life to some of the most vulnerable communities in the world. The choice to partner with C-Quest was easy knowing our carbon credit purchases would help improve lives while doing the same for the environment.
Figure 7.12
| Year | Total Wells | Total Components Reported* | Total Components Surveyed | Total Leaks Identified | Leaks Detected per 10,000 Components Surveyed |
|---|---|---|---|---|---|
| 2019 | 1,364 | 638,690 | 1,275,292 | 702 | 5.5 |
| 2020 | 1,488 | 685,596 | 2,742,385 | 923 | 3.4 |
| 2021 | 1,503 | 707,040 | 2,784,942 | 965 | 3.5 |
| 2022 | 1,512 | 741,214 | 3,635,379 | 1,349 | 3.7 |
*Derived from PA OGRE report
Some operational flaring is necessary in almost all oil and gas development to meet regulatory requirements and to maintain a safe work environment. Since Range’s primary objective is to produce gas to market while reducing emissions where possible, we are committed to minimizing flaring. Flared emissions reported by Range in 2022 include those resulting from safety flaring and small volumes of waste gas combusted in an enclosed device. Those volumes represent 0.03 percent of our 2022 production. We continue to disclose in this report those de minimis emissions from flaring in accordance with federal regulatory definitions, as seen in Figure 7.12, which has been our approach since we launched our first Corporate Sustainability Report. For more information, please see page Performance Indicators in the Appendix.
We continue to make progress on reducing emissions from flaring. Several of the initiatives discussed previously together with Range’s operating practices specifically contribute to the reductions of flaring activity:
Our continued commitment and these efforts have allowed us to achieve zero routine flaring as defined by the World Bank Zero Flaring Initiative.
Figure 7.13
| 2022 | 2021 | 2020 | 2019 | |
|---|---|---|---|---|
| Volume of Hydrocarbon Flared in PA (mmcfe) | 231.35 | 274.51 | 277.53 | 253.64 |
| Volume of Hydrocarbon Flared in North LA (mmcfe) | – | – | – | 82.82 |
| Total Quantity of Hydrocarbon Gas Flared (mmcfe) | 231.35 | 274.51 | 277.53 | 336.46 |
| Range GHG Emissions due to Flaring (MT CO2e) | 18,194 | 21,320 | 20,863 | 33,054 |
1Range began tracking and reporting on boosting and gathering-related emissions in 2016.
2 Graph reflects minor updates to 2021 data based on revised 2021 combustion emissions data. See Performance Indicators in report Appendix for full detail on revised data.
3 Graph reflects minor updates to 2021 data based on revised 2021 combustion emissions data. See Performance Indicators in report Appendix for full detail on revised data.
4 Graph reflects minor updates to 2021 data based on revised 2021 combustion emissions data. See Performance Indicators in report Appendix for full detail on revised data.
5 Emissions from North Louisiana assets, which were sold in 2020 are omitted from the above Production and Development Emissions to better compare changes over time.
6 Graph reflects minor updates to 2021 data based on revised 2021 combustion emissions data. See Performance Indicators in report Appendix for full detail on revised data.